THE "SCIENTIFIC" JUSTIFICATION FOR URINE DRUG TESTING
John Morgan, Medical professor and acting Chairman of Pharmacology, City
University of New York Medical School
KANSAS LAW REVIEW, 1988, Vol. 36, pp. 683-697
INTRODUCTION
Just as drug use is often ceremonial and ritualistic, discussions
about those problems have a communal, worshipful character. Individuals
have to speak out of strong conviction, and congregational beliefs are
strengthened in a confirmation of faith and shared attitudes. In recent
years, the experiences described above have been characterized by an
important cohesive element, a shared litany.
Since 1984, when urine testing of unimpaired civilian workers began
to expand rapidly, its public supporters have used a common set of
statements, ideas, and statistics to justify the imposition of the forced
detection and testing of urine for illegal drugs. The use of this
religious language is not without a purpose. Litany is seldom questioned,
nor is the speaker of litany often called upon to prove the truth of his
statements, even when they involve things material and not spiritual. I
believe this common set of statements used by those justifying and selling
urine tests is repeated, polished, and accepted with a minimal offering
of
proof. In this article, I will identify these statements, search for their
sources, and examine their accuracy.
II. THE FIRESTONE "STUDY"
Obviously, statements concerning the job performance of drug users
have an impact on their employers. From the earliest days of the debate,
a
series of statistics about drug-using workers, their poor productivity,
and
high cost to ther company have been presented.
In one of the first proceedings of a meeting directed to the issues
of drug abuse in the workplace, Robert Angarola and Judith Brunton stated:
A recent study....suggests that drug users were almost four times
as likely to be involved in a plant accident and were two and one-half
times as likely to be absent from work for more than a week than employees
who did not use drugs. Drug users were five times as likely to file
workers' compensation claims and they received three times the average
level of sick benefits. (1)
Further, the drug users were "repeatedly involved in grievance procedures."
The Angarola-Brunton document was published in 1984 but they and others
had begun making the remarks frequently by then
In 1987 testimony before the U.S. House of Representatives, by
Mark de Bernardo of the United States Chamber of Commerce:
'recreational' drug users are---
--2.2 times more likely to request early dismissal or time off...
--3.6 times more likely to injure themselves or another person in a
workplace accident.....
--5.0 times more likely to file a worker's compensation claim. (3)
For at least five years, these statistics and others like them have
been voiced and published by testing advocates, although seldom with de
Bernardo's decimal-point precision. Those whom I have quoted seem to be
referring to any user of illegal drugs and de Bernardo specifically speaks
of recreational drug user. Yet, one might wonder how these data were
gathered, particularly since drug testing in the workplace is proposed to
uncover the secret user. How were these users described by Angarola and
de
Bernardo (and many others) found and analyzed? The answer, as is often the
case is simple. They were not.
The most important source for dissemination of these statistics
seems to be the Drug Abuse and Alcoholism Newsletter of Dr. Sidney Cohen.
(4) This monthly newsletter is widely distributed and has been collected
and published. In the August 1983 newsletter, Cohen discussed a study by
the Firestone Tire and Rubber Company and constructed the quotable
statements which have appeared and reappeared: "Drug users were five
times
as likely to file a Workers' Compensation claim, and they received three
times the average level of sick benefits." (5)
The Firestone "Study" has never been published. Thus, Cohen's
newsletter seems to be the source of all such statements. Yet, Cohen
gave no attribution nor sources, and when I wrote to him in 1985 he
answered that he did not have a copy of the study and suggested I write
Firestone. After a number of calls and queries I received a two page
document from Firestone's Medical Director, E. Gates Morgan. The report
apears to be an in-house newsletter. (6) In it, a Mr. Ed Johnson is
interviewed about the Employer Assistance Program ("EAP") at Firestone.
There are some statements pertaining to absenteeism, but these are not
documented, and more importantly, refer only to a few alcoholics who have
been served by the Firestone EAP. The statistics generated (if these
calculations based on alcoholics were actually made) have nothing to do
with drug users, recreational or otherwise.
The statistics cited about absenteeism and workers' compensation
claims may have been derived from interviews with alcoholic workers
enrolled in the EAP at Firestone. These people were not identified by
urine testing for alcohol, but were referred because they or others
perceived that their lives were falling apart. They, unlike workers
randomly tested for drug use, were dysfunctional. To use them as a
justification for testing unimpaired workers is like demanding that all
workers have mandatory periodic rectal temperatures taken because a case
of
tuberculosis was found in the workplace.
III. THE RTI STUDY FOR DIMINISHED PRODUCTIVITY
The Research Triangle Institute ("RTI") of North Carolina issued
a
report in 1984 that attempted to calculate the economic cost to society
of
alcohol and drug abuse and mental illness. (7) It appears to be the
source of the claim that drug abuse costs the United States thirty-four
billion dollars a year in lost productivity. (8)
This claim seems to indicate that somehow individual worker
productivity was assessed by some quantitative measure and was noted to
be
seriously diminished. I often ask my students how they would design a
study which might quantify the effect of drug use or abuse on productivity
and they generate interesting ideas and designs. None, however, have ever
come up with anything as creative as the RTI report.
The National Institute on Drug Abuse ("NIDA") Household Survey
is
the actual source of the RTI statistics. (9) The RTI analysis itself does
not include any studies about productivity, dor does it document that drug
use was associated with any diminished productivity. The RTI report relied
on the 1982 version of the Household Survey, which included a question to
the adult (older than eighteen years of age) respondents about daily
marijuana use. If the respondent stated that he or she had ever used
marijuana daily for twenty or thirty days in one month, this respondent's
household income was compared to another household without a daily user.
The user households were estimated to have a household income approximately
twenty-eight percent less than those households that did not have such an
interviewee. According to the RTI report:
"These result have been used to calculate the reduced productivity
due to daily marijuana use. Once again, the prevalence rates of ever using
marijuana daily in the labor force by age and sex groups....were applied
to
the number of persons in the labor force from those groups that experienced
reducedproductivity. This number was multiplied by the expected
productivity in the workplace and in the household and then by the
impairment rate (27.9 percent) to produce the final value: The loss due
to
marijuana abuse was estimated at $34.2 billion for 1980." (10)
This somewhat opaque quotation means that the $34 billion "lost"
to
drug-induced diminished productivity and the one-third reduction is
productivity of the drug user come from a very unusual calculation. The
homes with daily users had a reduced household income. Because the daily
users all were between eighteen and thirty-four years of age, the
proportion of the work force represented by them was multiplied by total
income expected and this was multiplied by the reduction figure to generate
the $34 billion guess.
I have never seen a published analysis of the RTI study. It is a
complex and detailed document of one hundred thirty-seven pages whose
appendices number nearly one hundred thirty more. Although many of its
assumptions regarding the cost of alcohol and drug abuse are questionable,
I have focused only on the loss of productivity formulation.
The reduced income figure itself may be incorrect. It relies upon
reports from interviewees that they used drugs and relies upon their
estimates of household income. The income data were grouped in seven broad
categories with intervals as broad as $10,000. (11) To generate the
reduction figure with categories like this amounts to measuring centimeters
using a device graduated in meters.
The control households were generated by selecting a household
whose respondent resembled the marijuana use respondent. This meant that
the two respondents resembled each other in regard to age, education,
marital status, and occupation. (12) The similarities did not include
race, location, or nonchildren resident(s) in the household. Therefore,
a
twenty-four year-old single black, high school graduate brick-layer who
smokes marijuana and lives with his grandmother and uncle in Harlem, could
have his family income compared to a twenty-four year-old single white,
high school graduate, brick-layer living with his parents in an affluent
New Jersey suburb. If the household in Harlem had a lower income, it would
be attributed to diminished productivity caused by marijuana use.
As the RTI authors noted, however, the association between
marijuana use and reduced income is not necessarily causal. (13) Although
age and occupation were similar, the user may not have concerned himself
with income and may have made other job choices. (14) Moreover, the heavy
use of marijuana could have been secondary to job loss in a poor economy.
This manipulation, which assigned lost productivity to sometime
past heavy use of marijuana, did not show any association with current use
of marijuana (or any other drug), nor could it show any productivity
decrease due to past use of any other drug. It also could not show any
effect of any drug use in any person greater than age thirty-five. (15)
Thus, according to the study, regular use of marijuana in the past on the
part of females aged twenty-five to thirty-four cost the nation
$2,396,000,000. (16) However, marijuana use by females greater than
thirty-four, cost the nation nothing. (17) In males aged twenty to
twenty-four, regular marijuana use in the past would have cost the economy
$6,723,000,000. (18) On this basis, however, any use of cocaine,
prescription drugs, or phencyclidine (PCP) by this group cost the nation
nothing. Of course, the study really does not indicate this because its
inadequacy prevented any such calculations. Its inadequacy regarding the
marijuana calculations should be viewed in the same fashion. To stand in
front of an audience and say that drug use cost the nation $34 billion
dollars in decreased productivity is foolish and improper.
Readers may have noted that the past paragraphs followed the mode
of the RTI report and used income and productivity as equivalents. I do
not believe they are equivalents. Are those who choose to work in
positions where they earn less than the maximum possible less productive?
If so, a judge is less productive than a practicing lawyer, a medical
school professor is less productive than a practicing physician, a farmer
is less productive than a florist, and an elementary school teacher is less
productive than an owner of a day-care center.
IV. ILLEGAL DRUG USE IS DECLINING
In an affidavit filed in support of the federal government's
attempt to promote urine testing of certain federal employees under the
President's executive order, J. Michael Walsh characterized the drug
problems in America as pervasive:
"Overall, 70.4 million Americans age 12 and over 37% of the
population have used marijuana, cocaine or other illicit drugs at least
once in their lifetime. Nineteen percent of the population age 12 and over
36.8 million have used illicit drugs at least once in the past year, and
12
% at least once during the month prior to being surveyed." (19)
Walsh himself later notes that of the 70.4 million Americans who have tried
an illicit drug at least once in their lives, for most (sixty two million)
that drug was marijuana. (20)
Many of the proponents of testing use such data. Proponents,
however, do not often seem to notice that this same data reveals that
almost fifty percent of those who have ever used an illegal drug at least
once have not used an illegal drug in the past year and perhaps never will
again. (21)
The sources of these data are important and interesting and merit
careful attention. There are two important surveys funded by the National
Institute on Drug Abuse from which most of our knowledge about the use of
illegal drugs in the United States is derived. These surveys are the
National Household Survey and the annual High School Senior Survey. (22)
Both surveys, however, were not constructed to signal serious heavy drug
use:
"The unique contribution of serveys of the general population lies
in their ability to furnish prevalence estimates that include many forms
of
drug use that never come to the attention of medical and legal
authorities.....Survey responses permit classification of drug-using
behavior along a continuum of involvement, substituting empirical for
arbitrary definitions of medically or socially pathologic conditions, and
emphasizing the typical nature of the phenomenon rather than its most
dramatic manifestations." (23)
These words from the forward to the National Household Survey published
in
1983 seem particularly calm in the light of the frequent repetition of its
glaring numbers to induce employers and others to join in the zealot's
game.
The National Household Survey is a general population survey of
household members aged twelve and above and has been conducted every two
to
three years since 1971. It excludes individuals in institutionalized
settings (colleges, prisons, military bases) and, therefore, as
conservative. Because each respondent gives general data, it can monitor
trends by age and sex and other demographic variables.
The annual High School Senior Survey obtains self-reported
information from approximately 130 high schools in the continental United
States. Between 16,000 and 18,000 seniors are surveyed. In addition, the
investigators construct a sub sample of individuals from each class who
are
followed, yielding a longitudinal study.
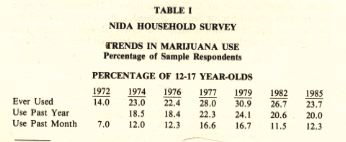
These two surveys do not yield a horrible story of an American
decline into profligate drug use, but exactly the opposite. Table I
depicts data from the Household Survey regarding marijuana use over time.
(24) Since 1979, the data indicate a significant decline in use among the
two important youth groups. In the eighteen to twenty-five group, the
percentage of the population that had ever used marijuana declined from
68.2% to 60.5% Those who had used marijuana in the year preceding the
survey declined from 46.9% to 37% and in the last month preceding the
survey, from 35.4% to 21.9%.
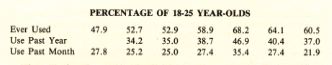
These national trends also are reflected in the High School Senior
Survey (Table II). (25) The apex of marijuana use in this group also was
noted in 1979 and has steadily declined. Marijuana use in the month
preceeding the survey fell from 33.7% to 23.4%. Daily use has steadily
declined from 10.3% to 4.0%
During the growing clamor to test working Americans, interest in
marijuana, the most widely-accepted illegal drug, has declined, and
declined significantly. This fact is not stressed by those frequently
quoting the two survey instruments.
The use of cocaine shows a different but still hopeful pattern.
Between 1974 and 1985, the lifetime prevalence of cocaine use increased
from 5.4 million users to 22.2 million users. (26) However, the trend in
the High School Senior Survy showed a distinct leveling off between 1982
and 1985 with a slight decrease. (27) In 1987, cocaine use by high school
students and young adults dropped twenty percent. (28) Again, a quarter
of
those reporting cocaine use had not used the drug in the last year. The
decline noted for marijuana has occurred in most drug categories in the
High School Survey including a decline in current and daily use of alcohol.
(29)
V. INDUSTRIAL ACCIDENTS AND RAILROAD EMPLOYEES
Among the fears fueling the drive to test is the specter of
industrial accidents and the likelihood of intoxicated workers harming
other workers and the public. The lack of data that drug use in industry
is harmful or an important cause of accidents does not deter the frequent
attribution of accidents to drug use.
Nowhere is this discussion more focused than on transportation. It
is impossible to raise arguments about testing without provoking commentary
on intoxicated airplane pilots and locomotive engineers. Perhaps the
strongest impetus to testing occurred on January 4, 1987, when a Conrail
engineer, who later tested positive for marijuana, ignored a number of
warning devices and pulled his train into the path of an Amtrak Metroliner.
(30) Sixteen people were killed. (31)
From February 10, 1986 to January 15, 1987, under the auspices of
the Federal Railroad Administration ("FRA"), most American rail
carriers
conducted an incident-based testing program. Any train accident or
incident associated with a fatality, injury, or nontrivial property damage
resulted in the testing of all operating personnel--- including the train
crews, dispatcher, and policemen. One hundred seventy-five events in the
year led to the testing of 759 employees. (32) Of the 759 employees
sampled, 43 tested positive for controlled substances including alcohol.
(33) Of the forty-three positives, the drugs identified were as follows:
Alcohol = 9 (1.2%)
Illicit drugs = 29 (3.8%)
Other controlled substances = 14 (1.8%).
(34)
The FRA made public the specific results only for the alcohol and
illicit drug positives, so it was not possible to know which licit drugs
(one assumes obtained by prescription) were identified in the fourteen
workers. Of the twenty-nine (3.8%)positives for illicit drugs, eighteen
had only THC carboxylic acid (marijuana metabolite). five had only
benzoylecgonine (cocaine metabolite) and six had both. (35) One
individual who tested positive for methamphetamine also had tested positive
for marijuana and is included in the eighteen. Despite its listing as
illicit, methamphetamine is still available in the United States as a licit
appetite depressant.
The FRA document correctly noted that these "data are not
conclusive of alcohol/drug role in industrial accidents." (36) Indeed,
of
the twenty-nine, at least seven had job classifications which would seem
to
place them at a distance from operating decisions (track patrolman, ticket
taker, conductor, road master). (37)
This costly program is not cited for what appears to be significant
evidence that illicit drugs do not play an obvious role in industrial rail
accidents. Furthermore, there is no reason to believe that an
investigation of other industrial accidents would yield a different
picture.
VI. MARIJUANA ISSUES
Because most workplace positives are due to marijuana metabolite
and most arguments revolve around the putative dangers of off-the-job
marijuana use, the details of cannabinoid testing are important. A review
of these details is, however, beyond the scope of this article. (38)
However, three points involving marijuana that are commonly used to provoke
testingt merit some discussion. First, the fat storage and carry-over
effect of marijuana. Second, the airplane simuator testing study.
Finally, the growing potency of domestically available marijuana.
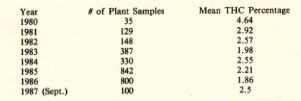
A. Fat Storage and Effect
The persistence and storage of THC and other cannainoids after use
is subject to much discussion and misunderstanding. Figure 1 depicts the
length of time THC remains in the plasma after an individual smokes
marijuana containing delta-9-THC (the intoxicating ingredient in
marijuana). (39) The pattern of distribution follows, with some
simplification, what pharmacologists refer to as a two-compartment model.
The drug initially enters the blood stream (compartment I) and then is
rapidly distributed to the deep compartment II, which is most of the body.
The initial rapidly declining concentration curve represents the
disappearance from the blood stream through distribution.

Three to four hours after the initial ingestion, the concentration
of delta-9-THC has fallen below 2-5 ng. ml in the blood. (40) This
concentration represents the minimal effective concentration. (41) Below
this concentration in the blood, the drug exerts no demonstrable effect.
We assume that like other drugs, the concentration has fallen so that the
complementary concentration in the brain and other receptor tissue is below
the threshold which will produce an effect. However, delta-9-THC remains
in the body.
The second phase of the disapearance curve is nearly level because
its decline is so gradual. This phase represents to some degree the drug's
redistribution from compartment II to compartment I. This slow decline is
used to calculate the terminal half-life (T 1/2) of THC. A low
concentration, say 1.0 ng ml, will take more than twenty-four hours to fall
to .05 ng / ml. (42) Actually, it probably takes even more time, but an
accurate calculation is difficult because of the inability to measure
extremely low concentrations.
This slow decline is the source of the popularly-held concept that
THC persists in the body's fat. From this another speculation usually
follows. The speculation is that the THC still is exerting some effect.
Current evidence simply says this is not so. There are many speculations
about the long-lasting effects of THC, but in the nearly thirty years since
delta-9-THC was discovered, nothing has been verified. The brain actually
contains little fat and there is no evidence to support the idea that the
drug particularly persists there. Frequent users will carry the drug and
its metabolites with them--even to the workplace--but they also will carry
some amount of organochlorine pesticide, lead, and the hydrocarbon solvent
used at work. We might better and more profitably examine the long term
effects of these substances.
B. Airplane Simulator Testing In Private Pilots
To justify the intrusion of testing, studies purporting to show a
lasting effect of marijuana have been widely cited. Marijuana users and
their defenders frequently state that marijuana use-off-the-job is no
different than alcohol use off-the -job.
The effects of marijuana and the selective impairment generated by
its use dissipate within three to four hours and generally correlate with
the decline in serum tetrahydrocannabinol (THC) to levels of less than 5
ng / ml. (43) The studies of Herbert Moskowitz and Robert Petersen that
indicate impairment of some psychomotor function for up to eight hours
(44) are puzzling and not entirely scientifically acceptable. However,
assuming they are correct, they still do not indicate that off-the-job drug
use causes on-the-job impairment. A study by Dr. Jerome Yesavage is
another matter. (45) This study using flight simulators has been widely
discussed and previously used as a strategic justification for urine
testing. (46) The study identifies significant impairment twenty-four
hours after smoking marijuana in a group of volunteer pilots who performed
on a flight simulator. (47) These conclusions are striking and have not
yet been replicated or confirmed.
After careful analysis of the article, I think that the
experimental methodology was so flawed that the study does not prove
impairment at twenty-four hours. (48) Briefly, the study was uncontrolled
and, therefore, scientifically unreliable. The subjects were studied with
no placebos or attempts to conceal the active treatment. Subject efforts
at a control run were compared to their efforts after they, and the
investigators, knew that they had consumed an active drug. This violates
elementary rules of study design and constitutes a serious flaw in the
study. The study also fails to deal with the characteristics and prior
drug experience of the volunteers, the issues of repeated testing and
training upon the simulator, and the generation of a large number of
simulator-generated measures some of which may have varied by chance. (49)
C. THC Content (Potency) of Domestically Available Marijuana
A commonly stated and widely accepted belief is that marijuana's
past record of causing minimal harm to users was based on the use of
low-grade material. Many plants, particularly those growing wild, have a
low content of delta-9-THC. (50) It is often stated that the THC content
has increased greatly. In fact, critics and proponents of testing sound
like dealers extolling the power of Hawaiian and California grown material.
"A glance at the percentages of THC in confiscated marijuana
would....[indicate] that marijuana is now as strong as hashish in THC
content," (51)
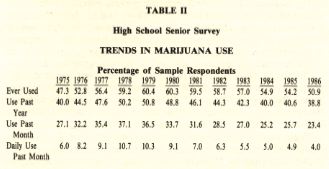
This particular claim also has been difficult to document.
However, NIDA has funded a THC analysis program at the University of
Mississippi since 1980. Under the program, the University analyzes plants
received chiefly by law enforcement agents, both federal (Drug Enforcement
Agency) and a variety of city and state criminal agencies. The
accompanying table lists the findings since 1980. (52)
The sampling is irregular but chiefly reflects material seized by
these agencies from the back yards, frms, and even indoor hydroponic
systems of growers. The most suspect year, 1980, of course, is the only
one in which the mean percentage exceeded three percent. There has been
no
real change and certainly no real increase in marijuana potency in the
1980's.
Interestingly, significant variation in THC content of marijuana
does not necessarily result in greater delivery. In a study of the
delivery of THC into smoke under standard conditions, 16-19% of the THC
content of a cigarette actually appeared in the smoke. (53) Increasing
the THC content under some circumstances did not influence delivery. For
example, cigarettes carefully prepared to contain 1.6% THC and 3.1% THC
delivered the same amount of THC in smoke. (54)
VII. CONCLUSIONS
This article has examined a series of rationales for the imposition
of urine testing onto unimpaired American workers. I have tried in good
faith to examine the arguments from the perspective of empirical studies
and appropriate analysis. I have accused, not subtly, the proponents of
testing of zealotry and improper use of statistics and data to support a
moral stance. To some degree my bias as a civil libertarian has affected
my evaluation. In the long run, however, the truth about this conflict
will depend upon ideas and data and not biography. Urine testing is a
wrong-headed intervention into the lives of some by those with power over
them. It is not a search for illness but a search for deviance conducted
in an un-American manner. Drug abuse is a specter of the 1980's resembling
the specter of domestic communism of the 1950's. Under the guise of
helping, the proponents of testing are creating enormous harm. Urine
testing is simply drug abuse abuse.
FOOTNOTES
1 Angarola & Brunton, "Substance Abuse in the Workplace: Legal
Implications for Corporate Actions," in SUBSTANCE ABUSE IN THE WORKPLACE
35-36 (1984) (hereinafter Angarola & Brunton).
2 id. at 36.
3 "Proficiency Standards for Drug Testing Laboratories: Hearings Before
a
Subcomm. of the House Comm. on Government Operations, 100th Cong., 1stt
Sess. 91-92 (1987) (statement of Mark de Bernardo, Special Counsel for
Domestic Policy and Manager of Labor Law. U.S. Chamber of Commerce)
[hereinafter Statement of de Bernardo].
4 See Angarola & Brunton, supra note 1, at 35.
5 Cohen, "Drugs in the Workplace," 12 DRUG ABUSE & ALCOHOLISM
NEWSL. I.
I (Aug. 1983).
6 Photocopy sent from E. Gates Morgan to Dr. John Morgan (Nov. 1986)
(discussing Firestone "Study") (copy on file at the Kansas Law
Review).
7. RESEARCH TRIANGLE INSTITUTE, ECONOMIC COSTS TO SOCIETY OF ALCOHOL AND
DRUG ABUSE AND MENTAL ILLNESS: 1980 (1984) [hereinafter RTI STUDY].
8. See Statement of de Bernardo, supra note 3, at 89. "$60 billion
is the
annual cost to the business community for drug abuse, a 30 percent increase
in only three years. One half of that cost is in lost productivity."
Id.
(emphasis in original). de Bernardo did not cite any source for this
statement. See also Church, "Thinking the Unthinkable," TIMEm
May 3,
1988, at 14 (chart).
9. See RTI STUDY, supra note 7, at 67-68 (citing NATIONAL INSTITUTE ON
DRUG ABUSE HIGHLIGHTS OF THE 1982 HOUSEHOLD SURVEY ON DRUG ABUSE (1983)
[hereinafter 1982 NATIONAL HOUSEHOLD SURVEY].
10. RTI STUDY, supra note 7, at A-22. Interestingly, the data relied upon
showed that adults thirty-five and older effectively had a zero prevalence
rate of ever using marijuana on a daily basis. Id. at A-20.
11. Id. at A-20.
12. Id. at A-9.
13. See id. at A-24.
14. Id.
15. See supra note 10.
16. See RTI STUDY, supra note 7, at 68.
17. Id.
18. Id.
19. Declaration of J. Michael Walsh, Ph.D., Director of Workplace
Initiatives, National Institute on Drug Abuse, at 2, submitted with
Department of Justice Memorandum of Support for Summary Judgment, American
Fed'n of Gov't Employees, Civ.No. 87-1797, 87-2350 (D.D.C. March 1, 1988)
[hereinafter Declaration of J. Michael Walsh, Ph.D.].
21. id.
22. NATIONAL HOUSEHOLD SURVEY, supra note 9; NATIONAL INSTITUTE ON DRUG
ABUSE US DEPT OF HEALTHE AND HUMAN SERVICES, NATIONAL TRENDS IN DRUG USE
AND RELATED FACTORS AMONG AMERICAN HIGH SCHOOL STUDENTS AND YOUNG ADULTS,
1975-1986 [hereinafter HIGH SCHOOL SENIOR SURVEY].
23. 1982 NATIONAL HOUSEHOLD SURVEY, supra note 9, at 1.
24. Kozel & Adams, "Epidemiology of Drug Abuse: An Overview,"
234
SCIENCE 970, (1986) [hereinafter Kozel & Adams] (citing NATIONAL
INSTITUTE ON DRUG ABUSE, HIGHLIGHT OF THE 1985 HOUSEHOLD SURVEY ON DRUG
ABUSE (Nov. 1986).
25. HIGH SCHOOL SENIOR SURVEY, supra note 22, at 47-50.
26. Kozel & Adams, supra note 24, at 973.
27. HIGH SCHOOL SENIOR SURVEY, supra note 22, at 47-50
28. Statement by Dr. Lloyd D. Johnstone, U.S. Dept. of Health and Human
Services News Conference (Jan. 13, 1988) (copy on file at the KANSAS LAW
REVIEW). Dr. Johnston is one of the principal authors of the High School
Senior Survey.
29. Id.
30. Se N.Y. Times, Jan. 5, 1987, at 1, col. 2.
31. Id.
32. Federal Railroad Administration, U.S. Dep't of Transp., Summary of
Post-Accident Testing Events Feb. 10, 1986 through Jan. 15, 1987
(summarized in 53 Fed. Reg. 46,641 (summary includes data through Dec. 31
1987).
33. Id.
34. Id.
35. Id.
36. Id.
37. Id.
38. See generally Morgan, "Marijuana Metabolism in the Context of Urine
Testing for Cannabinoid Metabolite, 20 J. PSYCHOACTIVE DRUGS 107 (1988).
[Editor's Note: See Miike & Hewitt, "Accuracy and Reliability of
Urine
Drug Tests. 36 KAN. L. REV. 641 (1988).
39. Id. at 109 (reprinted with permission).
40. Augerell, Lindgren, Ohlsson, Gillespie, & Hollister, "Recent
Studies
on the Pharmacokinetics of Delta-1-Tetrahydrocannabinol in Man," in
THE
CANNABINOIDS: CHEMICAL, PHARMACOLOGIC, AND THERAPEUTIC ASPECTS 167
(1984).
41. See id. at 179.
42. Cf. E. Johansson, Prolonged Elimination Half-life in Plasma of
delta-9-Tetrahydrocannabinol in Chronic Marihuana Users 41 (abstract of
presentation given Sept 4, 1987 ( copy on file at the Kansas Law Review).
43. See supra notes 40-42 and accompanying test.
44. H. Moskowitz & R. Petersen, MARIJUANA AND DRIVING -- A REVIEW
(1980).
45. Yesavage, Leirer, Denari & Hollister, "Carry-Over Effects of
Marijuana Intoxication on Aircraft Pilot Performance: A Preliminary
Report," 142 AM. J. PSYCHIATRY 1325 (1985) [hereinafter Yesavage].
46. See, e.g., Declaration of Dr. Marian W. Fischman Associate Professor,
Department of Psychiatry and Behavioral Sciences, Johns Hopkins University
School of Medicine, at 2, submitted with Department of Justice Memorandum
of Law in Support of Motion for Summary Judgment, American Fed'n of Gov't
Employees v. Dole, Civ. No. 87-1815 GAG (D.D.C. Sept. 30, 1987);
Declaration of J. Michael Walsh, Ph.D., supra note 19, at 6.
47. Yesavage, supra note 45, at 1328.
48. See Morgan, "Carry-Over Effects of Marijuana," 144 AM. J.
PSYCHIATRY
259, 259-60 (1987) (letter to the editor); see also Greenblatt,
"Marijuana Test Fails in Scientific Design," N.Y. Times, Apr.
30, 1986 at
A-30 col. 4 (letter to the editor).
49. Whenever one measures many variables using a five percent level of
significance, one in twenty will vary by chance.
50. See Mikurya & Aldrich, "Cannabis 1988 Old Drug, New Dangers,
The
Potency Question," 20 J. PSYCHOACTIVE DRUGS 47, 52 (1988).
51. S. Cohen, THE SUBSTANCE ABUSE PROBLEMS,VOLUME TWO, NEW ISSUES FOR THE
1980's 65 (1985) (citing NATIONAL RESEARCH COUNCIL, AN ANALYSIS OF
MARIJUANA POLICY (1982).
52. Telephone interview with Carol Abel, University of Mississippi
Research Institute (Feb. 4, 1988).
53. Davis, McDaniel, Cadwell & Moody, "Some Smoking Characteristics
of
Marijuana Cigarettes," in THE CANNABINOIDS: CHEMICAL, PHARMACOLOGIC,
AND
THERAPEUTIC ASPECTS 102 (1984).
54. Id.
INDEX
HOME